Wilmer KarlssonTarstad
Last Updated: November 22, 2026
Key Takeaways
- Platform average is 5.2%, but industry benchmarks range from 2.8% to 4.13% for engagement rate
- Construction leads at 4.13%, while Finance and Education lag at 2.8-3.2%
- Personal profiles outperform company pages by 63% on engagement
- Recruiting has highest reply rates (18-25%), Tech/SaaS lowest (4.77%)
- Company size dramatically impacts performance; nano accounts (1-5K followers) average 5.42% engagement
What Are LinkedIn Benchmark Metrics and Why They Matter
LinkedIn benchmark metrics are quantifiable performance standards that measure how your content, profile, and company page perform against comparable accounts in your industry. They track engagement rates, impression reach, click-through rates, follower growth, and conversion metrics. But here's the critical distinction: knowing your benchmark matters far more than chasing platform averages.
LinkedIn's overall engagement rate sits around 5.20% by impressions, but this number is nearly useless for strategy. A software company's 3% engagement rate might actually outperform 90% of its direct competitors, while a consumer goods brand hitting 6% could be underperforming significantly. Personal profiles consistently beat company pages by 63% on average engagement rate, yet many organizations only measure company page performance. That's a strategic blind spot.
Industry verticals create dramatic performance gaps. Financial services, technology, healthcare, and manufacturing each operate under different competitive pressures, audience behaviors, and content consumption patterns. Your true benchmark isn't what LinkedIn reports across all 900+ million users; it's what your peers in your specific industry are actually achieving right now.
Without industry-specific benchmarks, you're essentially flying blind. You might celebrate a metric that's actually mediocre for your sector, or feel discouraged by performance that's genuinely strong. The urgency is real: your competitors are already measuring themselves against the right standards. If you're not, you're making decisions based on incomplete information. Understanding your real benchmark transforms how you set goals, allocate resources, and measure success.
LinkedIn Engagement Rate Benchmarks by Industry: The Complete 2026 Data
Your engagement rate tells you whether your content resonates with your audience or merely exists in their feed. The industry you operate in shapes that metric dramatically, which is why comparing yourself to LinkedIn's platform average (typically 1.5% to 3%) is practically useless.
Construction, mining, and manufacturing lead all B2B sectors at 4.13% engagement, followed by retail at 3.9% and marketing agencies at 3.7%. These industries benefit from visual storytelling; construction can showcase projects in progress, while retail thrives on product-focused content that invites immediate reaction. Technology companies average 3.6%, a respectable middle ground, while healthcare sits at 3.3% and professional services at 3.2%. The engagement curve flattens considerably in finance and insurance, currently posting 2.6% to 3.2%, though this sector saw impressive year-over-year growth, climbing from 1.9% in 2025 to 2.6% in 2026.
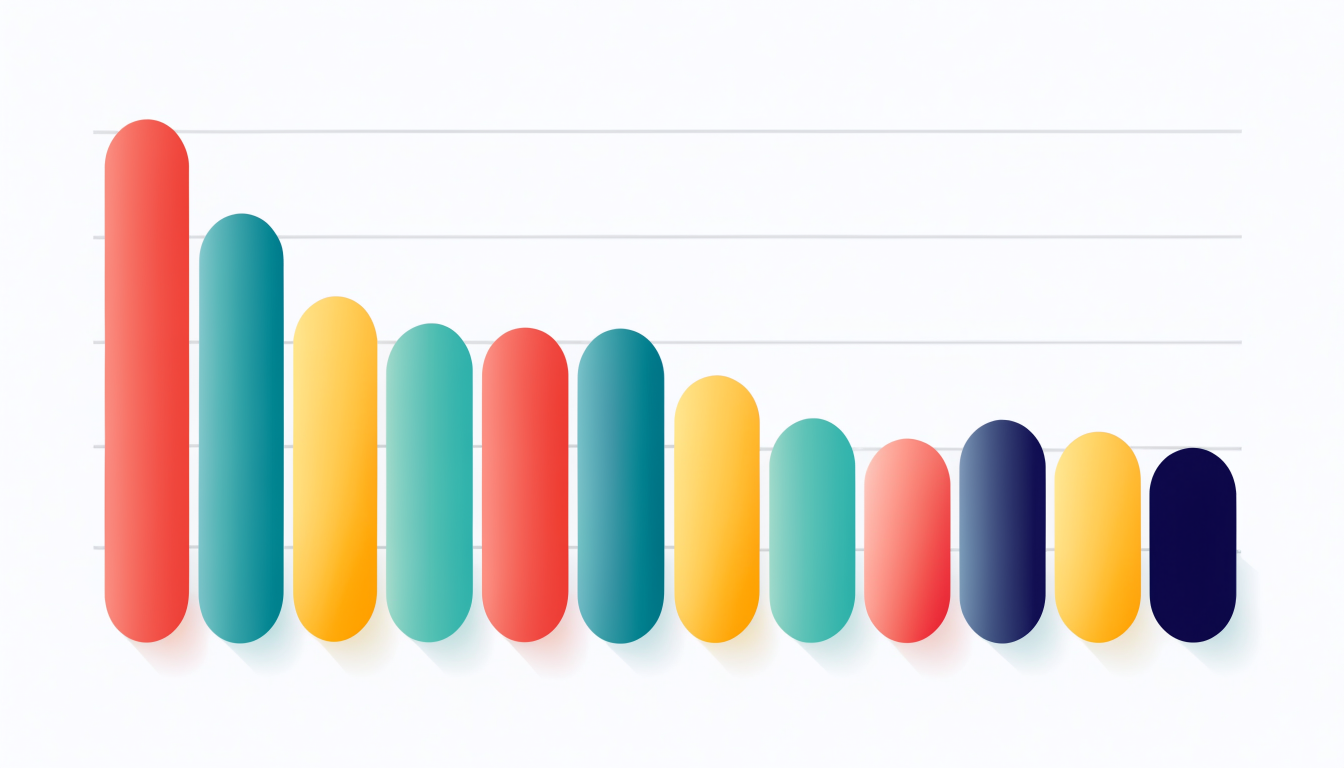
The gap between median and top performers is striking. While your industry median might hover around 3%, the top 10% in construction reaches 16.12%, and education and eLearning achieves 15.13%. This spread reveals a critical truth: industry doesn't determine your ceiling; execution does. Lower-performing sectors like education and finance aren't constrained by their audiences; they're often constrained by content strategy. These industries tend toward longer-form, credential-heavy posts when their audiences actually respond better to practical insights and conversational tone.
Understanding where your industry baseline sits gives you realistic expectations. If you're in finance posting at 2.8%, you're not failing; you're meeting standard. But knowing that top performers in your sector hit 9.67% means the infrastructure for higher engagement exists. Your benchmark isn't the median. It's the performance of companies doing it right in your space. That's your real target.
Company Size and Scale: How Your Organization's Size Affects Performance
Your company size isn't just context; it fundamentally reshapes how your LinkedIn metrics should be interpreted. A 3% engagement rate means something entirely different at a 50-person startup versus a 10,000-person enterprise. Ignoring this distinction is one of the most common mistakes when benchmarking performance.
Nano accounts with 1K to 5K followers post a median engagement rate of 5.42%, nearly triple what large enterprises typically achieve. This isn't a failure on the enterprise side; it's math and visibility working against you. Smaller teams have tighter networks, more authentic voice, and less algorithmic friction. As you scale, engagement naturally compresses.
The pattern becomes even sharper in certain industries. Technology engagement drops from 37.9% in the 11-50 employee band to 15.2% in the 1,001-5,000 band. But Business Services shows the opposite trend: larger companies in this sector often outperform smaller ones, reaching engagement rates that reward institutional credibility. Financial Services reaches a P90 engagement rate of 21.4% among large organizations, suggesting that scale here signals authority rather than distance.

Here's what matters: stop comparing yourself to platform-wide averages. Find peers in your industry and size bracket, then benchmark honestly against them. A mid-market SaaS company should track against other mid-market SaaS companies, not Fortune 500s posting quarterly earnings. This reframing transforms benchmarking from demoralizing to actionable. You'll finally see whether you're actually underperforming or simply operating under different structural conditions.
Personal Profiles vs. Company Pages: The 63% Engagement Gap You Can't Ignore
Here's the uncomfortable truth: your company page is underperforming, and LinkedIn's algorithm knows it. Personal profiles average 3.85% engagement compared to just 2.1% for company pages, a gap that compounds when you factor in reach. According to research on personal vs. company page performance, personal profiles typically see 2-5x more organic reach than their corporate counterparts. Even more striking, personal profiles generate 237% more comments per post.
Why does this happen? LinkedIn's algorithm prioritizes person-to-person connection over corporate broadcasting. The platform treats content from individuals as inherently more trustworthy and engaging than messaging from faceless organizations. When Sarah Chen, your VP of Product, shares insights on her personal profile, the algorithm assumes it's authentic conversation. When your company page posts the same content, it reads as marketing.
The strategic implication is clear: your best performers aren't your company page posts. They're your founders, executives, and team members sharing authentic perspectives on personal profiles. Consider the compounding effect: if five team members each post twice weekly with 3%+ engagement rates, you're generating significantly more visibility than relying solely on your company page.
This doesn't mean abandoning your company page. Instead, treat it as a secondary distribution channel for curated content. Your personal profiles become the primary engine. Executives posting thought leadership regularly achieve 3-6% engagement on personal accounts, far exceeding company page benchmarks.
The balance matters. Route employee-generated content to personal profiles first, then repurpose selectively on the company page. This layered approach respects the algorithm's preferences while maintaining brand consistency. When optimizing content strategy, tools that analyze personal profile performance help identify what resonates before scaling it company-wide. The 63% engagement gap isn't a limitation; it's a roadmap pointing you toward where your audience actually pays attention.
Beyond Engagement: Reply Rates, Connection Rates, and Outreach Metrics
Engagement rate tells only half the story. The metrics that actually predict revenue and business outcomes shift dramatically based on your industry and outreach strategy.
Reply rates are the true north star for direct outreach, and they vary wildly across sectors. Recruiting and Staffing sees the highest reply rates at 18-25%, while SaaS and Technology struggles at just 4.77% due to chronic inbox saturation. If you're in tech, don't panic at that number; it's not a failure. It's a reality check that cold outreach requires heavier lifting, better personalization, or a shift toward account-based strategies. Professional Services leads non-recruiting industries at approximately 10.42% reply rates, positioning it as the sweet spot for B2B outreach outside staffing.
Connection acceptance rates tell a different story entirely, ranging from 25-50% depending on your industry and target audience seniority. Higher-level decision makers accept fewer requests; more junior professionals accept more. This isn't a weakness; it's a segmentation opportunity.
Here's what matters most: outreach reply rates and organic engagement metrics are completely separate universes. A post generating 3% engagement doesn't predict your 1-to-1 message response rate. Organic content builds authority and warm audiences; direct outreach converts specific targets. You need benchmarks for both, measured independently.
For paid LinkedIn campaigns, the math shifts again. CPM ranges from $26.56 to $47.74 by industry, while landing page click-through rates span from 0.05% to 0.32%. Tech and Finance typically see higher CPMs but better CTR conversion. Healthcare and B2B Services face lower CPMs but must optimize landing page experience harder.
Your benchmark strategy should isolate these metrics by your actual business goal: brand awareness, lead generation, or direct sales. Then compare only against your industry peers using the same outreach method. A recruiter benchmarking against a SaaS company is measuring apples against oranges. Know which metric moves your needle, then obsess over it.
How to Use These Benchmarks: Setting Goals and Measuring Progress
Benchmarks only matter if you know how to read them. Most platforms report averages, which get skewed by outliers; the median tells the real story. If your industry's median engagement rate sits at 3.85%, hitting that number means you're outperforming roughly half your peers. That's significant. Top 10% performance, by contrast, requires a different strategy altogether.
Here's how to set goals that actually stick: Start by finding your current baseline across your key metrics (engagement rate, follower growth rate, click-through rate, whatever matters most to your role). Compare it honestly to your industry median. If you're below median, your first goal is reaching it. Once there, aim two tiers higher. This approach prevents both complacency and burnout.
Tracking matters more than any single number. Take monthly snapshots of your metrics, not just quarterly checks. Trends reveal what's working; isolated data points lie. A 2% engagement rate in January followed by 4% in March tells you something changed for the better. A one-off spike tells you nothing.
Content format dramatically shifts benchmark expectations. Video and carousel posts naturally outperform text-only updates in most industries, so don't compare your text-post performance to someone's video benchmark. That's comparing apples to oranges.
Use your benchmark gaps as a diagnostic tool. If you're hitting median on engagement but lagging on profile clicks, your content resonates but your call-to-action strategy needs work. This specificity turns data into actionable direction.
The challenge: manually tracking across platforms creates friction and invites errors. You need systems that consolidate your LinkedIn metrics, compare them automatically to industry standards, and highlight where you're gaining or losing ground. This removes guesswork and keeps you accountable to what actually matters.
FAQ: Common Questions About LinkedIn Benchmarks by Industry
Is 3% engagement rate good?
It depends entirely on your industry. A 3% engagement rate is excellent in Finance or Legal services, where audiences engage more cautiously with professional content. In Construction or Manufacturing, however, 3% falls below average. Rather than chasing a universal number, compare yourself against companies in your specific sector and company size.
Why do different sources report different benchmarks?
Methodology matters. One source might measure engagement as likes plus comments divided by impressions; another includes shares and clicks. Sample sizes vary too. Some reports analyze 500 profiles; others use 50,000. The time period matters as well. A benchmark from 2024 won't reflect 2026 dynamics. Always check how data was collected before accepting it as your target.
How often should I post to hit benchmarks?
Posting frequency isn't one-size-fits-all. Construction peaks at 4.13% engagement when posting 2 or 20 times per week, showing that consistency matters more than a specific cadence. Test both extremes for your industry, then measure which rhythm generates better results for your audience.
Should I focus on engagement rate or total reach?
This hinges on your goal. If you're generating leads, engagement rate matters more because it signals genuine interest from decision-makers. If you're building brand awareness, reach is the metric. Most B2B professionals should prioritize engagement, since a smaller audience of engaged prospects outperforms a large, passive one.
What's the fastest way to improve my benchmarks?
Shift content to personal profiles rather than company pages. Personal profiles typically see 5-10x higher engagement. Next, optimize your post format. Video and carousel posts outperform static images consistently. Finally, post when your specific audience is active, not when platform averages suggest.
How do I know if my benchmark is accurate?
Find three to five comparable companies in your industry with similar headcount and revenue. Track their engagement, reach, and posting patterns over 30 days. This peer group becomes your real benchmark, not generic industry data. Your business is unique; your benchmark should be too.
Benchmark Your LinkedIn Performance and Optimize for Growth
You now have the data. The 5.2% platform average is a red herring; your real benchmark lives in your industry median, shaped by company size, profile type, and content strategy. Personal profiles consistently outperform company pages by 63%, and what works for a 50-person startup looks nothing like what works for an enterprise. Comparing yourself to the wrong standard wastes months of effort chasing irrelevant targets.
But here's what matters most: benchmarking is only diagnosis. Optimization is the cure.
Knowing you're below your industry median tells you something's wrong. It doesn't tell you what to fix. Are your headlines weak? Is your posting cadence irregular? Are you attracting the wrong audience? The gap between knowing your benchmark and closing it requires systematic tracking, A/B testing, and real-time course correction.
This is where most professionals stall. They pull a report once, feel discouraged or confident, then stop measuring. LinkedIn's native analytics are fragmented; comparing your metrics across months or against industry standards requires manual work that bleeds into spreadsheets and guesswork.
The next step is concrete: pull your current metrics today, map them against your true industry benchmark (not the platform average), and identify your biggest gap. Then commit to weekly tracking. Tools that automate this measurement and surface optimization opportunities eliminate the friction between insight and action.
Your industry benchmark isn't a ceiling; it's a starting line. The real growth happens when you measure consistently, test systematically, and optimize relentlessly. Start measuring today. Your future performance depends on the decision you make right now.