How to Measure Content Performance and Prove Its ROI
Learn how to measure content performance beyond vanity metrics. This guide shows you how to track, analyze, and report on the data that proves content ROI.
Wilmer KarlssonTarstad
To really nail content performance, you need a simple, repeatable framework. It boils down to three things: setting clear goals for each stage of your funnel, tracking everything consistently, and then actually analyzing that data to make smarter calls.
This whole process is about shifting your focus from vanity metrics like page views to the actual user behaviors that drive business growth.
Moving Beyond Views to Measure True Content Impact
Let's be honest—proving the value of your content beyond surface-level stats is a never-ending battle for marketers. Clicks and views are easy to slap on a report, but they don't tell the full story. They don't explain how a blog post influenced a demo request or how a LinkedIn article actually contributed to the sales pipeline.
True measurement connects your content efforts directly to business outcomes. It’s that simple.
This requires a real mental shift. The industry is already moving away from old-school metrics and toward deeper signals of engagement. Take "engaged sessions"—visits that last longer than 10 seconds and involve real interaction. That's becoming the new baseline. Privacy changes and AI-driven personalization are only speeding this up, making it non-negotiable to focus on relevance and what users do, not just what they see.
Your Measurement Workflow
To get started, you need a simple process you can run over and over again. This is our go-to workflow. It’s built on those three core pillars: defining clear goals, tracking the right data, and analyzing the results to figure out your next move.
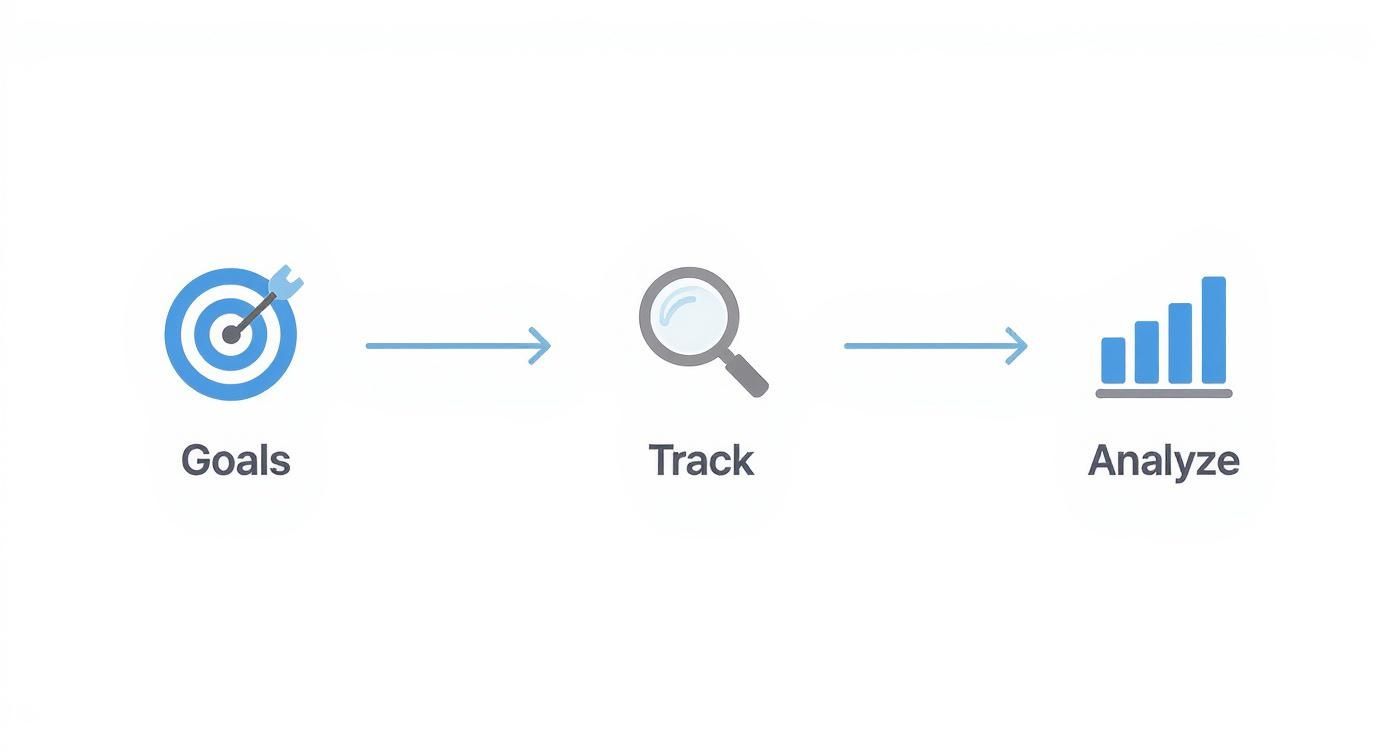
This workflow ensures every single piece of content has a purpose and a way to measure its success. It turns measurement from a reactive, end-of-quarter chore into a proactive, strategic tool you use every day.
From Data Points to Actionable Insights
Collecting data is only half the battle. The real magic happens when you connect those scattered data points into a clear story that proves ROI. Diving deep into attribution and measurement strategies is what separates marketers who report on activity from those who report on impact.
Think about it. A single insightful article can be a total workhorse. It might bring in traffic and build brand awareness through organic search, get shared on social to establish you as an authority, and then be repackaged as a lead magnet to capture emails. By tracking each one of those touchpoints, you see its full contribution to the pipeline.
And if you want to get the absolute most out of every asset, exploring a few proven content repurposing strategies can dramatically extend the life and impact of your best-performing work.
The goal isn't just to report numbers; it's to answer the question, "So what?" Effective measurement tells you what's working, what's a waste of time, and exactly where to put your budget for the biggest returns.
Ultimately, this data-backed approach gives you the confidence to double down on the content formats and channels that are actually moving the needle. It's how you justify your budget and prove your team's value to the bottom line.
Building Your Measurement Foundation
Look, effective content measurement doesn’t start when you open a dashboard. It starts way before that. It begins with a solid foundation—a reliable data pipeline built on clear goals and consistent tracking. If you skip this part, you're just collecting noisy data that tells you almost nothing about what’s actually working.
First things first: you have to define what success even looks like. Vague goals like "increase traffic" are useless. You need to tie your content goals directly to real business objectives. Are you trying to get more qualified leads for the sales team? Drive free trial sign-ups? Cut down on customer support tickets with better how-to guides? Each of those goals demands a completely different set of metrics.
Let's say you're a B2B company. A concrete goal might be to generate 50 marketing-qualified leads (MQLs) per month from your blog. That single, clear objective instantly tells you what to track: newsletter sign-ups from blog posts, ebook downloads, and "Contact Us" submissions. Simple as that.

Implementing Your Tracking System
Once you know your goals, it's time to get technical. This is where you build the plumbing that ensures clean, trustworthy data flows into your analytics. Without consistency here, you’ll never really know which channels or campaigns are driving the results.
Your tracking system needs two core components, non-negotiable:
- Standardized UTM Parameters: Seriously, you have to use UTMs. It's the only way to truly understand where your traffic is coming from. Create a simple, shared spreadsheet for your team that defines the exact structure for
utm_source,utm_medium, andutm_campaign. This stops messy data like having "linkedin," "LinkedIn," and "li" all showing up as different sources. - Key Conversion Events: In Google Analytics 4 (GA4), you need to set up specific events that match your goals. This could be a "demo_request" event that fires when someone submits that form, or a "guide_download" event for a lead magnet. These are the actions that signal someone is actually moving down the funnel.
Don’t overcomplicate this at the start. Pick 3-5 critical conversion events that map directly to your main business goals. You can always add more later, but getting the basics right is everything.
Pulling It All Together
Okay, so your data is scattered. You've got website behavior in GA4, lead progression in your CRM, and social engagement on platforms like LinkedIn. The final piece of the foundation is bringing it all together.
You don't need a fancy, expensive tool on day one. You can start by manually pulling the most important numbers into a simple spreadsheet or a free tool like Google Looker Studio. The whole point is to create a single view where you can see the entire user journey, from that first click on a LinkedIn post all the way to a final conversion on your site.
This isn’t just about collecting numbers; it's about connecting the dots between average engagement time, clicks, conversions, and eventually, revenue. When you set up a framework that reports on these goal completions, you turn content measurement into a precise, data-driven feedback loop. As the folks at Measureschool often point out, you have to create these data-driven feedback loops to see what's really going on. Building this foundation isn't just a step—it's the most critical step in figuring out how to measure content performance effectively.
Choosing the Right Metrics for Each Channel
Metrics aren't one-size-fits-all. A 'like' on Instagram means something entirely different from a demo request that came from a blog post. If you really want to get a handle on your content performance, you have to pick KPIs that actually align with what each channel is built to do.
Trying to slap the same success criteria on everything is a surefire way to end up with confusing, useless data.
Think about it this way: a top-of-funnel blog post built for organic search should be judged on its ability to pull in new eyeballs. So you’d be watching things like organic traffic, keyword rankings, and new vs. returning visitors. But an email newsletter? Its success is all about audience retention and getting them to act. That means open rate, click-through rate (CTR), and unsubscribe rate are your go-to indicators.
When you're trying to figure out which numbers to focus on, it's crucial to understand what metrics truly matter for content performance so you don't get sidetracked by vanity stats.
A Real-World B2B LinkedIn Campaign
Let’s walk through a practical B2B scenario. Imagine you’re running a LinkedIn campaign to push a new whitepaper, and the real goal is to generate sales pipeline. You can't just glance at post impressions and call it a win.
Here's how you’d actually connect the dots from start to finish:
- First, on LinkedIn: You’ll track the native platform metrics. This means keeping an eye on impressions (how many people saw it), engagement rate (how many cared enough to interact), and the click-through rate on your link.
- Next, on your landing page: This is where UTMs come in. You'll track how many people who clicked your LinkedIn link actually made it to the landing page. The big metric here is the form submission rate—the percentage of visitors who trade their email for the whitepaper.
- Finally, in your CRM: Here’s where the real magic happens. You trace those fresh leads from the whitepaper download. You'll track how many become Marketing Qualified Leads (MQLs), then Sales Qualified Leads (SQLs), and ultimately, how many result in a demo booked or a new opportunity in the pipeline.
This end-to-end view is absolutely critical. If you want to go deeper on tying social media activity to actual business results, our guide on https://getviews.ai/blog/linkedin-attribution-roi-2025 lays out a complete framework.
By tracking the user's journey from the initial social media click all the way to a sales opportunity, you move beyond channel-specific metrics and start measuring true business impact.
Primary KPIs Across Different Content Channels
To make this a bit more concrete, it helps to see what the primary KPIs look like side-by-side for the most common content channels. This table gives you a clear playbook for what to prioritize on each platform.
| Content Channel | Awareness Metrics | Engagement Metrics | Conversion Metrics |
|---|---|---|---|
| Organic Search (Blog) | Organic Traffic, Keyword Rankings, Impressions | Avg. Engagement Time, Scroll Depth, Bounce Rate | Form Submissions, New Subscribers, Demo Requests |
| Social Media (LinkedIn) | Reach, Impressions, Video Views | Likes, Comments, Shares, Click-Through Rate (CTR) | Lead Gen Form Fills, Website Clicks, DMs Started |
| Email Marketing | Open Rate, Delivery Rate | Click-Through Rate (CTR), Reply Rate, Forward Rate | Goal Completions (e.g., webinar sign-ups), Unsubscribes |
Use this as a starting point. It helps you focus on what really matters for each channel, ensuring your measurement strategy is targeted and actually tells you something useful.
Connecting Your Data to Business Goals
So, you have a mountain of data. Traffic is up. Engagement looks good. You can see which blog posts people are reading.
But collecting data is the easy part. The real work starts when your CEO or Head of Sales asks, "So what? How did this content actually help us get customers?"
This is where you shift from reporting on activity (views, likes, shares) to demonstrating impact (pipeline, revenue, closed deals). It's all about attribution—connecting the dots between a piece of content and a conversion.
And honestly, this is where most marketers get stuck. A recent study found 56% of B2B marketers say attributing ROI and tracking the customer journey is their biggest challenge. The tools are there, but stitching together fragmented data to tell a clear story is a massive hurdle. You can see more on these content marketing statistics over at Chad-Wyatt.com.
Choosing the Right Attribution Model
Attribution isn't one-size-fits-all. The model you pick depends entirely on your sales cycle. A quick B2C purchase is simple. A complex B2B sale, with multiple decision-makers over six months? That’s a different beast entirely.
Here are the common models people use:
- First-Touch Attribution: This gives 100% of the credit to the very first piece of content a prospect saw. It’s perfect for understanding what's driving top-of-funnel awareness and bringing new people into your world.
- Last-Touch Attribution: The opposite. All the credit goes to the final touchpoint before someone converted. Think of it as the "closer"—the case study they read right before requesting a demo.
- Multi-Touch Attribution: This is where it gets interesting. Models like linear, time-decay, or U-shaped spread the credit across multiple touchpoints. This gives you a more realistic view of how a blog post, a webinar, and a whitepaper all worked together to nurture a lead.
For most B2B companies with a sales cycle longer than a few weeks, a multi-touch model is the only way to get an accurate picture. It recognizes that the first blog post someone read six months ago is just as important as the final demo they requested last week.
From Leads to Revenue
The ultimate goal? Tying every piece of content directly to revenue. This is how you prove ROI, secure bigger budgets, and move from being a "content person" to a revenue driver.
This requires a tight link between your analytics (like GA4) and your CRM (like HubSpot or Salesforce).
Start by tracking content-influenced leads. It's as simple as adding a custom field in your CRM to tag which asset a lead engaged with before they converted. Over time, you can pull reports showing how many of those leads turned into paying customers.
This data lets you calculate the true return on your content and gives you a much clearer picture of what it costs to acquire a customer. For a deeper dive, we have a whole guide on how to properly handle customer acquisition cost calculation.
When you can translate analytics into a clear narrative of business growth, you’ve won the game.
Creating a Reporting Cadence That Drives Action
Collecting data is one thing. Actually using it is a whole different ballgame. The real magic happens when your measurement becomes a consistent feedback loop, turning raw numbers into strategic adjustments.
Without a regular reporting schedule, even the best data ends up sitting untouched in a dashboard. Establishing a rhythm for reviewing performance is how you stop guessing and start building a content strategy that actually evolves and gets better over time.
This isn't about adding more meetings to everyone's calendar. It's about getting the right information to the right people at the right moment so they can make smart decisions. Your content team needs the granular, day-to-day details. Your executive team needs the high-level summary that connects content directly to revenue. A solid reporting cadence makes sure everyone gets what they need to act.
Tailoring Reports for Different Audiences
A one-size-fits-all report is a recipe for getting ignored. To make your data hit home, you have to tailor the focus, frequency, and format to who you're talking to. Think of it as creating different "views" of the same core data—each designed to answer a specific set of questions.
Here’s a practical breakdown you can steal:
-
Weekly Check-ins (For the Content Team): This is your quick, tactical huddle. The focus is on campaign-specific metrics, what’s popping off right now, and any sudden dips or spikes you need to investigate. The goal is to make immediate tweaks—like putting more promotional fuel behind a high-performing post or rewriting a headline on one that’s falling flat.
-
Monthly Reviews (For Marketing Leadership): Now we zoom out a bit. This report should track progress against your main KPIs. You’ll want to highlight trends in traffic sources, conversion rates from your pillar content, and the number of MQLs your content generated. This is where you connect the team's daily activities to the broader marketing goals.
-
Quarterly Business Reviews (For Executives): This is the big picture. Forget vanity metrics; the focus here is strictly on ROI and strategic impact. You should be presenting hard numbers on content-influenced pipeline, the cost per acquisition from your content efforts, and how the strategy is contributing to overall business growth. Use simple, clean charts they can understand in 30 seconds.
The best reports don't just present data; they tell a story. Every single report, no matter the audience, should clearly answer three questions: "What happened?", "Why did it happen?", and "What are we going to do about it?"
Building a Dashboard That Actually Gets Used
Your dashboard should be your single source of truth. A centralized view built in a tool like Google Looker Studio can pull everything together from Google Analytics, your CRM, and social platforms. This alone will save you countless hours of manually pulling reports and gives everyone a real-time pulse on what’s working.
When you build it, prioritize clarity over cramming in every metric you can find.
Start with the big-picture summaries at the top—think total traffic, leads, and pipeline generated. Then, let people drill down into the more specific data from there. Visuals are your best friend. A line chart is perfect for showing traffic trends over time, while a simple pie chart can break down your acquisition channels at a glance.
This visual-first approach makes your content performance easy to understand in seconds and helps build a culture where people naturally look at the data before making a call.
Common Questions About Measuring Content Performance
Even with a perfect framework on paper, the real world of content measurement is messy. Questions always pop up once you get your hands dirty. You're not alone. We've fielded hundreds of these over the years, and a few common themes always emerge.
Think of this as the troubleshooting guide for those little hurdles that can derail your entire measurement system. Getting these details right is what makes the difference.

What Are the Most Common Mistakes to Avoid?
I see two mistakes cripple content teams more than any others.
The first is obsessing over vanity metrics. Raw page views and social media likes feel good, but they don't pay the bills. If you can't connect that traffic spike to a real business outcome—like a demo request or a new lead—it’s just noise.
The second, and arguably more damaging, is inconsistent UTM parameters. One person uses "linkedin-post" and another uses "LinkedIn_Post," and suddenly your source data is a complete mess. It makes accurate tracking impossible and completely undermines your team's credibility.
Beyond that, I often see teams picking the wrong attribution model for their sales cycle or reporting so infrequently that the insights are stale by the time anyone sees them. Nail these basics first.
How Often Should I Report on Content Performance?
There’s no magic number here. The right reporting cadence depends entirely on who you’re talking to. Drowning your CEO in weekly data is just as bad as leaving your content team in the dark for a month.
A three-tiered approach has always worked best for me:
- Weekly Check-ins: This is for the content team—the people in the trenches. It’s a quick pulse-check on active campaigns, top-performing posts, and any immediate red flags.
- Monthly Reports: This is for marketing leadership. It rolls up the weekly data to show progress against your main KPIs. Are we on track to hit our MQL target? How is our organic traffic trending?
- Quarterly Reviews: This is for the C-suite. It connects all your content efforts back to strategic impact and ROI. Think pipeline influenced, customer acquisition cost, and revenue generated.
The goal isn't just to share data; it's to provide actionable insights. Every single report, no matter the audience, should clearly answer the "so what?" and guide what the team does next.
This rhythm ensures everyone gets the right level of detail at the right time, turning data from a chore into a strategic advantage.
Which Tools Are Essential for Content Performance Measurement?
You really don't need a massive, expensive tech stack to get started. In fact, you can build an incredibly powerful measurement system with just three core tools. Don't overcomplicate it.
Start with these fundamentals:
- Google Analytics 4: This is non-negotiable. It’s your source of truth for website traffic, user behavior, and on-site conversions. If you don't have GA4 set up properly, you're flying blind.
- Native Social Media Analytics: Each platform—LinkedIn, X, etc.—gives you crucial data on reach, impressions, and engagement right in their own dashboards. This is where you'll find your top-of-funnel signals.
- A Dashboarding Tool: You need one place to pull everything together. A tool like Google Looker Studio is perfect for this, but honestly, a well-structured spreadsheet can work wonders when you're starting out.
This simple setup gives you everything you need to start connecting your content efforts to real business results. Master these before you even think about buying another tool.
Ready to turn your LinkedIn into a predictable revenue machine? At GetViews.AI, we help you create high-performing content that builds pipeline without cold outreach. Learn more at https://getviews.ai.